Ticket resolution metrics
PERMISSIONS Security level with Admin permission to configure Service Desk (Tickets). Refer to Admin security settings.
NAVIGATION Left Navigation Menu > Admin > Admin Categories > Features & Settings > Service Desk (Tickets) > Ticket Resolution Metrics
About ticket resolution metrics
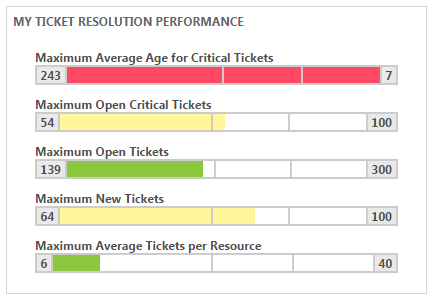
The Ticket Resolution Metrics section on the Service Desk Dashboard shows a series of horizontal bar graphs that measure the actual performance of the support team against self-determined goals. To open the page, use the path(s) in the Security and navigation section above.
The number on the right side of the bar graph is the performance goal for the current month. The number on the left side represents the actual numbers. The colored bar graph in the middle indicates how the team is tracking against the performance goal.
If current ticket numbers are less than 50% of the maximum number, the bar is green. 50-75% displays in yellow, and over 75% displays in red.
The following performance metrics are available:
By default, all performance metrics are displayed on the dashboard. System Administrators can edit the list of performance metrics to inactivate a performance metric (they will not appear on the Dashboard), change the performance metric sort order, and edit the performance goals.


